Trajectories
Tools > Trajectories (Ctrl+J), or double-click a cell in the video.
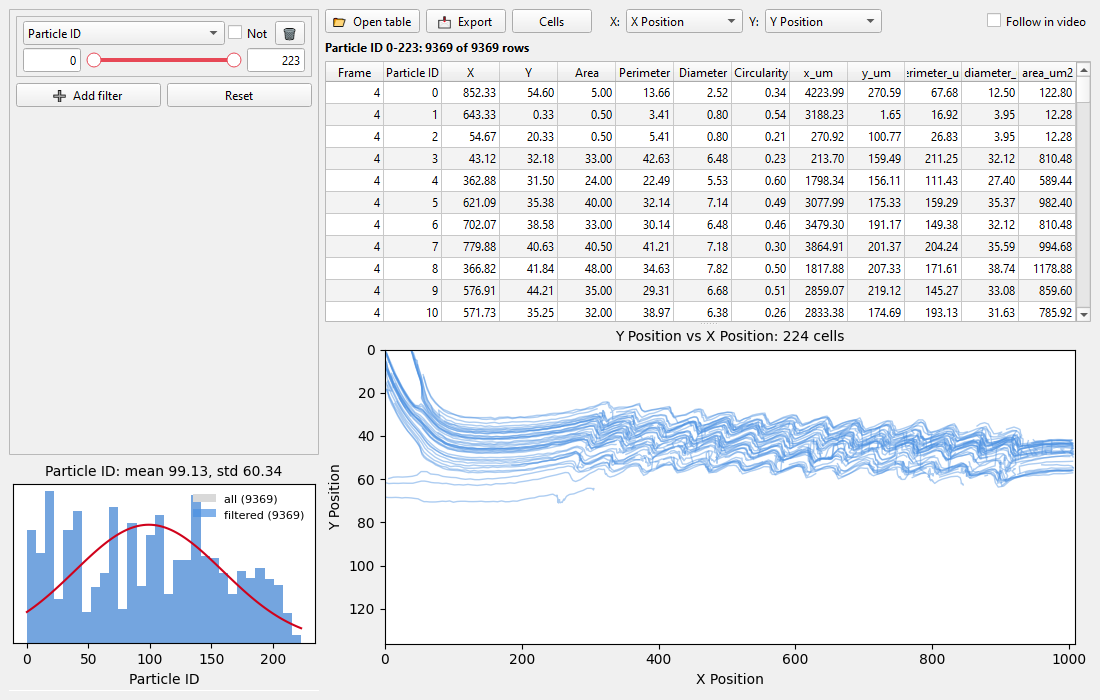
Every tracked point is one row: cell, frame, position, area, perimeter, diameter, circularity, and with a calibration the same in micrometres and seconds.
Filters
Add filter, choose a column and drag the two handles or type the bounds. Several filters combine with AND or OR, and Not inverts one. The table, the plot and the histogram follow as you drag; the line above the table names the active filters. Reset removes them. Filters are saved with the preset.
The histogram under the filters shows the column of the filter you are setting, for all rows and for the filtered ones.
Plot
Choose any two columns for X and Y. With X Position and Y Position the plot spans the tracked picture, y downwards as in the video.
Click a row or a point to highlight that cell. With Follow in video ticked, the main window jumps to that frame and selects the cell.
Per cell
Cells shows one row per cell of the filtered rows: when it was seen, displacement, path length, mean speed, mean size and shape.
Tables from a file
Open table loads a saved table (.xlsx, .csv, .txt) instead of the tracked points; extra numeric columns
become filterable too. With a video open, Use for Video makes the table the tracks of that video, so rows
can be followed and traces are drawn. TraCell checks that frames and positions fit the video; it cannot tell
whether the table really belongs to it.
Export writes the rows shown, all or only the filtered ones.