Live Dashboard
Tools > Live Dashboard, or Dashboard in the Live Tracking window.
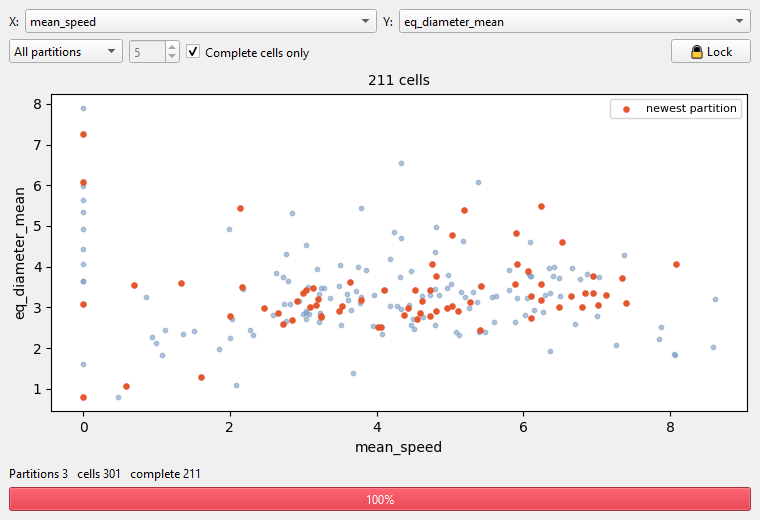
One point per tracked cell, added as each partition finishes.
- X and Y: any two per-cell values, for example mean speed against diameter.
- Scope: all partitions, the newest, or the last few.
- Complete cells only leaves out cells cut by the start or end of a partition.
- Lock freezes the plot while the session goes on.
- A progress bar per stop rule shows how far the session is.
The points of the newest partition are drawn in a second colour.